

Sonoma County Real Estate Market Update: July 2026 Brings Stronger Competition Despite Fewer Homes for Sale
QUICK ANSWER
Sonoma County’s July 2026 housing market remained competitive despite fewer homes changing hands. Inventory fell 18.6% year over year to 878 homes, while 37.9% of homes sold above list price and sellers received an average 102.6% of list price. Homes sold in a median of 35 days—five days faster than a year earlier—and price per square foot increased 5.1% to $531. The median sale price was $834,000, down 1.3% year over year, suggesting the headline median alone does not capture the market’s underlying strength.
Sonoma County Housing Market Overview
The Sonoma County real estate market remained resilient in July 2026, even as fewer homes changed hands. The clearest story in the latest Vanguard Properties Market Update is the relationship between supply and competition: there were substantially fewer homes available to buyers, yet the homes that did sell showed stronger bidding and faster market times.
Month-end inventory fell to 878 single-family homes, down 18.6% from July 2025 and representing 201 fewer options for buyers. At the same time, 37.9% of properties sold above list price, up from 30.9% a year earlier, and sellers received an average of 102.6% of list price.
Buyer Competition Intensified
More Homes Sold Above Asking
The share of Sonoma County properties selling above asking price jumped to 37.9% in July, up 7 percentage points—a 22.7% increase—from 30.9% a year earlier. Sellers also received an average of 102.6% of their list price, up 3.6 points year over year.
For buyers, this means well-priced, move-in-ready homes are drawing multiple offers, and preparation before house-hunting matters more than ever.
Homes Are Moving Faster
The median home spent 35 days on market in July, five days fewer than a year earlier. For buyers, this can mean desirable homes may require quicker decisions. For sellers, it reinforces the importance of preparing a property well and entering the market with a thoughtful pricing strategy.
Inventory Continued to Tighten
Available inventory fell to 878 homes at the end of July, down 18.6% from 1,079 homes a year earlier—201 fewer choices for buyers than in July 2025.
This ongoing inventory decline continues to be the single biggest factor driving competition across Sonoma County, and it remains a strong advantage for sellers who price and present their homes strategically.
Home Prices Dipped Slightly, But Underlying Value Held Firm
The median sale price for Sonoma County single-family homes was $834,000 in July, down 1.3% from $845,226 a year ago and down 4.7% from June.
However, price per square foot—often a clearer read on underlying value—climbed 5.1% year over year to $531. Combined with faster sales and stronger bidding activity, this suggests the modest dip in median price likely reflects the mix of homes that sold in July rather than a broad decline in value.
Contract Activity Held Close to Sales Volume
Homes going into contract fell 9.1% year over year to 348, a pullback that was considerably smaller than the 18.6% drop in inventory. That gap suggests limited selection, rather than a lack of buyer interest, is the main constraint on activity. July sales also remained well above 2023 levels, reinforcing the market's overall stability.
Economic Backdrop Supports Market Stability
Local and national economic indicators point to continued support for Sonoma County's housing market. Santa Rosa and Petaluma nonfarm employment grew 0.5% year over year through June, with gains of 2.7% in education and health services and 2.3% in leisure and hospitality. Nationally, inflation eased for a second consecutive month in July, with core inflation falling to 2.5%. Freddie Mac reported mortgage rates holding relatively stable at 6.67%, alongside improving affordability and increased mortgage application activity—encouraging signs for buyers who had been waiting on the sidelines.
Regional Snapshot: Sonoma County Communities
City-level data isn't reported monthly, but the most recent quarterly figures (Q2 2026 vs. Q2 2025) show how performance has varied by community. Bodega Bay posted the strongest median price growth at 34%, followed by Cotati (11%), Glen Ellen (9%), and Healdsburg (9%). Sonoma also saw a healthy 4% gain, while Rohnert Park rose 3%. Santa Rosa (-2%), Windsor (-2%), and Sebastopol (-17%) saw modest price pullbacks, reflecting differences in local inventory and buyer demand.
Market Snapshot
| Metric | July 2026 | Vs. July 2025 | Vs. June 2026 |
|---|---|---|---|
| Median Sale Price | $834,000 | -1.3% | -4.7% |
| Price Per Square Foot | $531 | +5.1% | — |
| Properties Sold | 372 | -4.1% | — |
| Went Into Contract | 348 | -9.1% | — |
| Inventory Available (End of Month) | 878 | -18.6% | — |
| Median Days on Market | 35 | -12.5% | +4 days |
| Average List Price Received | 102.6% | +3.6 pts | — |
| Properties Sold Above List Price | 37.9% | +7.0 pts | — |
Single-family homes, Sonoma County. Source: SFAR Super Regional MLS & BrokerMetrics via Vanguard Properties.
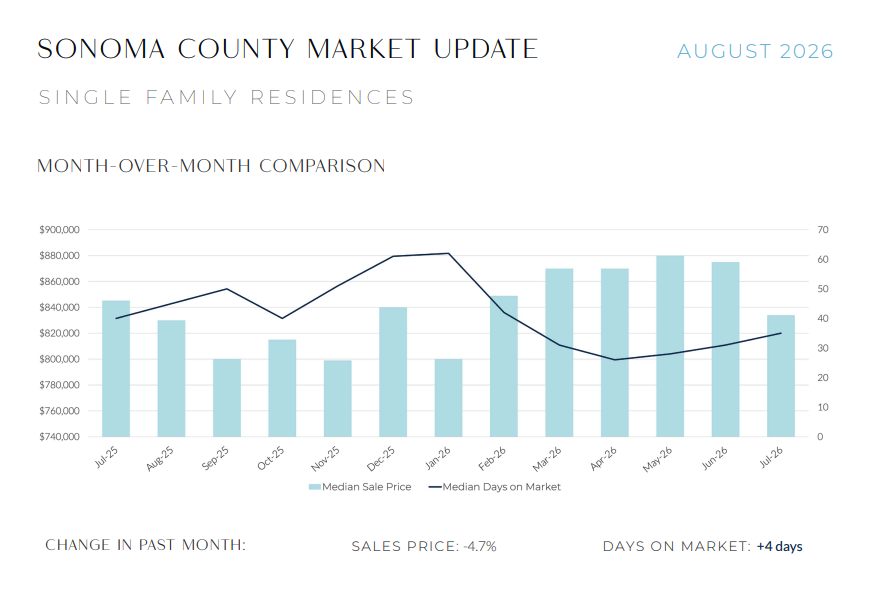
Line and bar chart showing Sonoma County median home sale price and days on market trends, July 2025 to July 2026
Buyer Takeaways
- Inventory is tight: 878 homes, down 18.6% year over year. Be ready to move quickly on well-priced listings.
- Competition is real: 37.9% of homes sold above asking, and sellers averaged 102.6% of list price.
- Homes are selling 5 days faster than a year ago, so pre-approval and a clear must-have list can save valuable time.
- Price per square foot rose 5.1% year over year—don't read the median price dip as a market-wide discount.
- Mortgage rates have held relatively steady at 6.67%, and affordability is improving slightly.
Seller Takeaways
- Limited inventory continues to favor sellers, especially for move-in-ready, well-presented homes.
- Nearly 4 in 10 homes sold above list price in July—strategic pricing can spark competitive offers.
- Homes are moving faster, with a 35-day median, rewarding sellers who list with strong presentation and pricing.
- Buyer demand remains steady even as sales volume eased, meaning serious, motivated buyers are still active.
City/Region Highlights
Based on the most recent quarterly (Q2 2026) regional data available:
| Region | Homes Sold Q2 '26 | Homes Sold Q2 '25 | Change | Median Price Q2 '26 | Median Price Q2 '25 | Change |
|---|---|---|---|---|---|---|
| Bodega Bay | 16* | 13* | +23% | $1,775,000 | $1,325,000 | +34% |
| Cotati | 11* | 12* | -8% | $915,000 | $826,000 | +11% |
| Glen Ellen | 13* | 11* | +18% | $1,525,000 | $1,400,000 | +9% |
| Healdsburg | 45* | 47* | -4% | $1,330,000 | $1,225,000 | +9% |
| Sonoma | 114 | 79 | +44% | $1,249,000 | $1,200,000 | +4% |
| Rohnert Park | 82 | 91 | -10% | $772,000 | $752,000 | +3% |
| Santa Rosa | 417 | 413 | +1% | $780,000 | $793,000 | -2% |
| Windsor | 67 | 63 | +6% | $826,000 | $840,000 | -2% |
| Sebastopol | 65 | 60 | +8% | $1,150,000 | $1,377,500 | -17% |
| Petaluma | 141 | 144 | -2% | $957,500 | $956,000 | 0% |
*Small sample size; use caution when interpreting these figures. Full county and regional detail available in the complete Vanguard Properties report.
Looking Ahead
Sonoma County's housing market appears well-positioned heading into the fall. Easing inflation, steady local job growth, and mortgage rates holding below recent peaks may continue to support buyer activity. Inventory remains the market's biggest challenge, and competition for well-priced homes is likely to persist until more listings come to market. Whether you're planning to buy, sell, or simply keep a pulse on local trends, understanding these shifts can help you make confident, informed real estate decisions.
Frequently Asked Questions
Are home prices dropping in Sonoma County?
Not meaningfully. The July 2026 median sale price of $834,000 was down just 1.3% year over year, while price per square foot actually rose 5.1% to $531—suggesting the modest median dip reflects which homes sold, not a broad decline in value.
Is now a good time to buy in Sonoma County?
With inventory tight and mortgage rates holding near 6.67%, buyers who are pre-approved and ready to act can find opportunity, though they should expect competition for well-priced homes.
How competitive is the Sonoma County housing market?
Very competitive: 37.9% of homes sold above asking price in July 2026, and sellers received an average of 102.6% of their list price.
How much housing inventory is available in Sonoma County?
As of the end of July 2026, 878 homes were available for sale, down 18.6%—201 fewer homes—than a year earlier.
Market Data Source
Source: SFAR Super Regional MLS & BrokerMetrics. Property types covered: Single-family. Only property data posted on the MLS is covered.
Disclaimer: All information is deemed reliable, but not guaranteed for accuracy. All data is subject to errors, omissions, revisions, and is not warranted.
©2026 Vanguard Properties. All rights reserved. Equal Housing Opportunity. DRE No. 01486075.
Thinking About Buying or Selling in Sonoma County?
Contact Milli Cannata, REALTOR® / Broker Associate
Vanguard Properties
(707) 477-7839 | DRE #01990936
Own Your Dreams.
Categories
Recent Posts






GET MORE INFORMATION

Broker Associate Lic# DRE# 01990936