

Sonoma County Real Estate Market Update: June 2026

Quick Answer
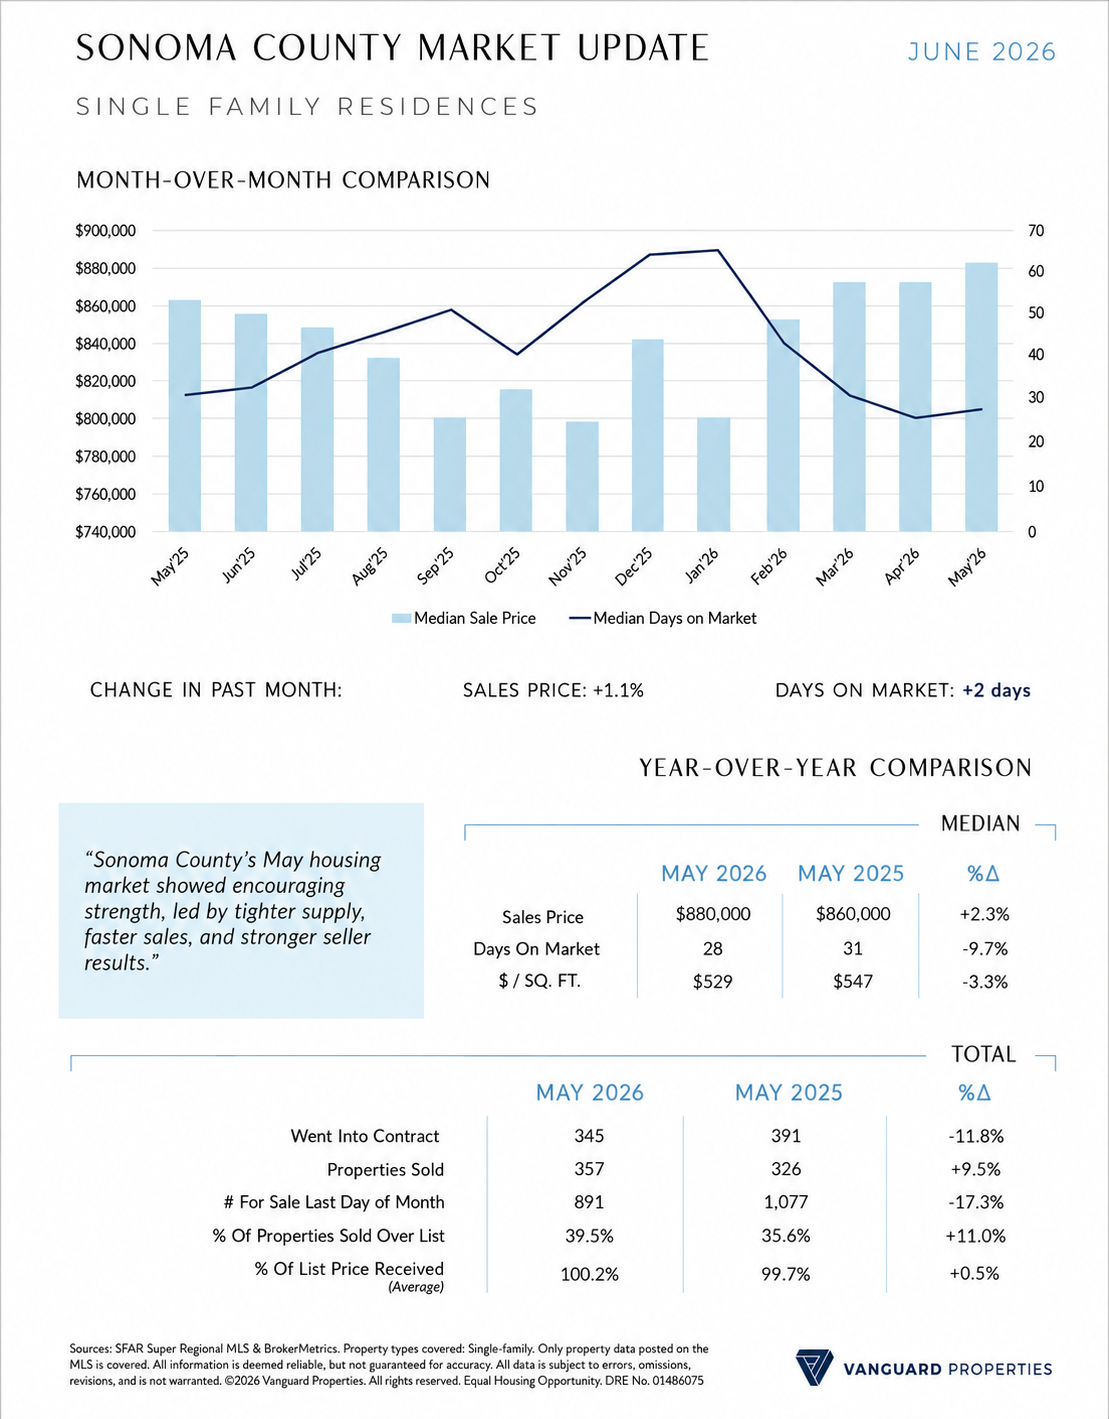
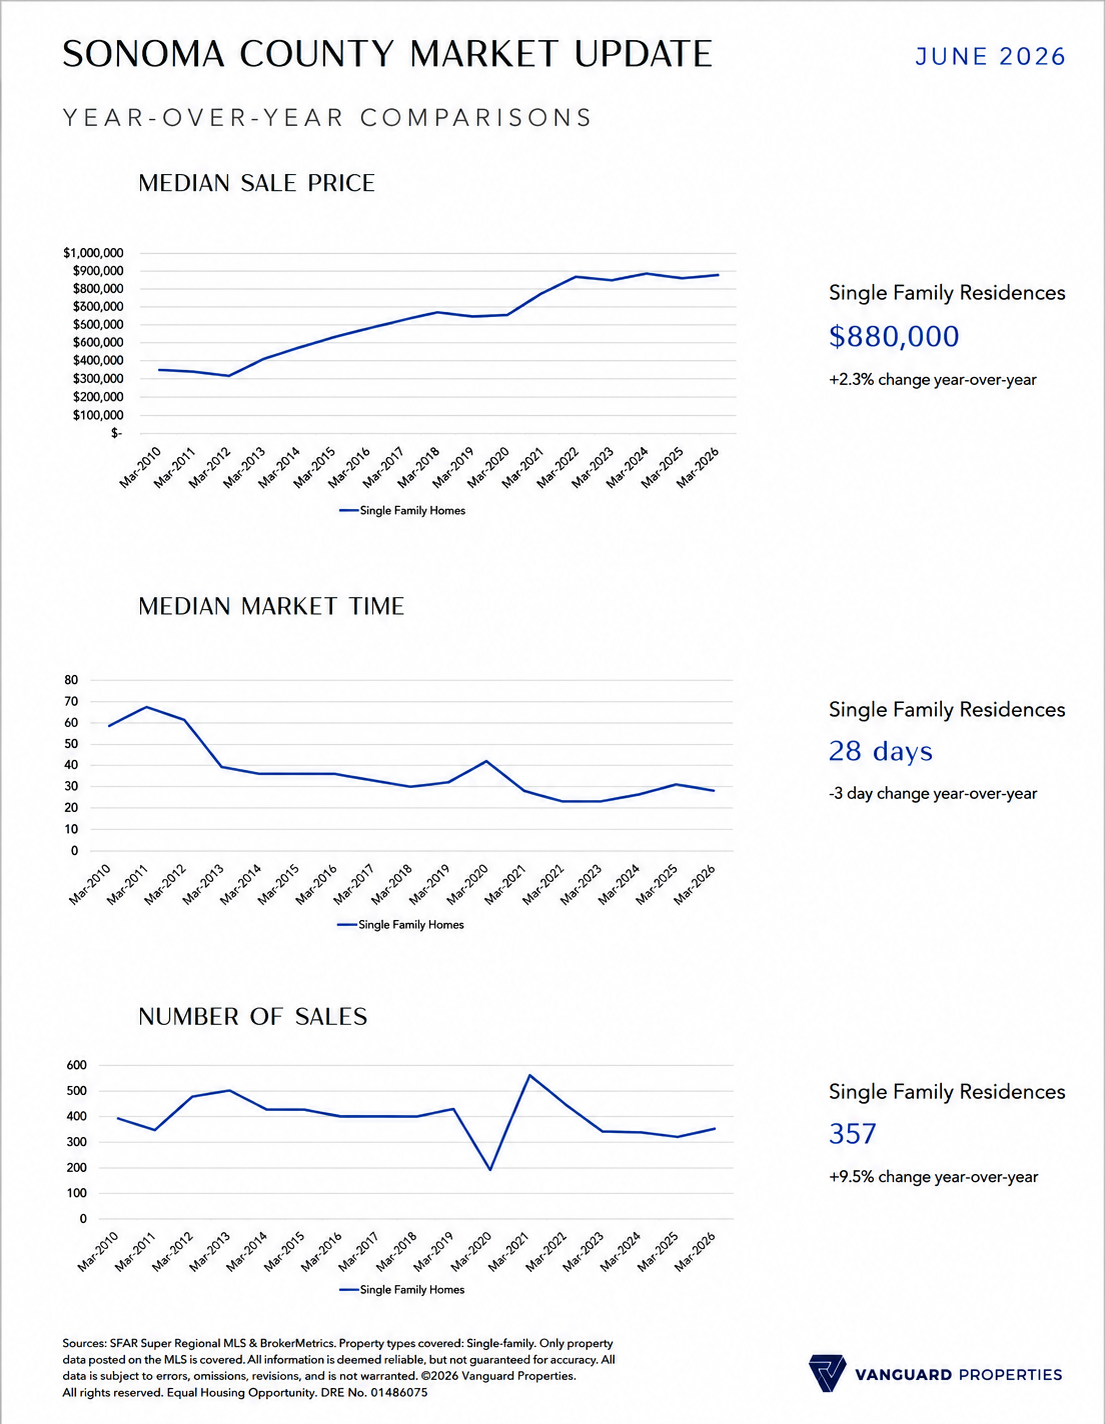
Sonoma County's May 2026 housing market showed real strength for sellers: inventory dropped 17.3% year over year, closed sales rose 9.5%, and nearly 40% of homes sold over list price. The median sales price reached $880,000, up 2.3% year over year, while homes sold faster, in a median of 28 days. Buyers are still active, but tighter supply is putting well-priced Sonoma County homes back in the driver's seat.
Sonoma County Housing Market Snapshot
Sonoma County's spring market carried real momentum into May. Available single-family inventory finished the month 17.3% lower than a year ago, while closed sales increased 9.5%, creating a more competitive environment for well-positioned listings across Santa Rosa, Petaluma, Sonoma, Sebastopol, Healdsburg, and the surrounding communities.
That competition showed up clearly in the sale metrics. Nearly 40% of Sonoma County homes sold over list price, up 11.0% from last year, and sellers received an average of 100.2% of list price. Homes also moved faster, with median days on market falling by three days to 28 days.
Pricing Trends Across Sonoma County
Pricing was mixed in May. The median sales price rose 2.3% year over year to $880,000, while the median price per square foot declined 3.3% to $529. In the context of lower inventory, faster market times, more closed sales, and stronger over-asking activity, this pricing pattern points to a healthier market than the headline numbers alone suggest.
Contract Activity and Buyer Behavior
The one softer metric was contract volume, which declined 11.8% year over year. With inventory also meaningfully lower, this appears at least partly supply-driven rather than a sign of falling demand. Buyers remain active in Sonoma County, but they are selective, and the best-priced homes are still drawing strong attention and multiple offers.
Economic Backdrop
The broader backdrop remains supportive for Sonoma County buyers and sellers. Mortgage rates remain elevated but are below year-ago levels, easing some affordability pressure. The national labor market remains steady, and Sonoma County's unemployment rate has improved from last year, reinforcing local economic stability.
Market Snapshot Table
Sonoma County single-family residences, May 2026 vs. May 2025:
|
Metric |
May 2026 |
May 2025 |
Change |
|
Median Sales Price |
$880,000 |
$860,000 |
+2.3% |
|
Days on Market (Median) |
28 days |
31 days |
-9.7% (-3 days) |
|
Price Per Square Foot (Median) |
$529 |
$547 |
-3.3% |
|
Properties Sold |
357 |
326 |
+9.5% |
|
Went Into Contract |
345 |
391 |
-11.8% |
|
For Sale (End of Month) |
891 |
1,077 |
-17.3% |
|
% Sold Over List Price |
39.5% |
35.6% |
+11.0% |
|
Avg. % of List Price Received |
100.2% |
99.7% |
+0.5% |
Sonoma County City & Region Highlights
Home prices and market pace continue to vary by community. Here's a look at first-quarter 2026 activity across several key Sonoma County cities and regions:
|
City / Region |
Homes Sold (Q1 '26) |
Median DOM (Q1 '26) |
Median Sale Price (Q1 '26) |
|
Santa Rosa |
273 |
44 |
$750,000 |
|
Petaluma |
75 |
25 |
$1,050,000 |
|
Sonoma |
60 |
39 |
$1,000,000 |
|
Rohnert Park |
50 |
29 |
$767,000 |
|
Sebastopol |
36 |
27 |
$1,200,000 |
|
Healdsburg |
32 |
83 |
$979,975 |
|
Windsor |
27 |
23 |
$869,000 |
|
Guerneville |
17 |
109 |
$450,000 |
Santa Rosa led the county in total sales volume with 273 homes sold, while Sebastopol and Petaluma posted the highest median sale prices among the county's larger markets. Healdsburg and Guerneville saw longer median market times, reflecting more specialized inventory in those areas.
Buyer Takeaways
- Inventory is down 17.3% year over year, so well-priced Sonoma County listings are attracting more competition than a year ago.
- Nearly 40% of homes are selling over list price, so buyers should be prepared with a clear strategy and pre-approval in hand before touring.
- Homes are moving faster, with a median of 28 days on market, leaving less time to deliberate on the right property.
- Mortgage rates remain below year-ago levels, which may offer a window of improved affordability compared to last spring.
Seller Takeaways
- Sellers are receiving an average of 100.2% of list price, and nearly 4 in 10 homes are selling over asking.
- Lower inventory (down 17.3% year over year) means less competition from other Sonoma County listings right now.
- Homes are selling three days faster than last year, a sign of sustained buyer demand for well-positioned properties.
- Pricing strategy still matters: with price-per-square-foot down 3.3% year over year, accurate, data-backed pricing helps homes stand out and perform.
Frequently Asked Questions
Are Sonoma County home prices rising in 2026?
Yes. The median sales price in Sonoma County rose 2.3% year over year to $880,000 in May 2026, even as price per square foot softened slightly.
Is now a good time to sell a home in Sonoma County?
Current data suggests favorable conditions for sellers: inventory is down 17.3% year over year, nearly 40% of homes are selling over list price, and homes are selling faster than last year.
How fast are homes selling in Sonoma County?
Homes sold in a median of 28 days in May 2026, three days faster than the same month last year.
Is Sonoma County housing inventory tight right now?
Yes. Active single-family inventory finished May 2026 down 17.3% compared to May 2025, tightening options for buyers.
What is the median home price in Sonoma County?
The countywide median sales price for single-family homes was $880,000 in May 2026, though prices vary significantly by city, from around $450,000 in Guerneville to over $1.2 million in Sebastopol.
Thinking about buying, selling, investing, or repositioning a property in Sonoma County or the greater Bay Area? Let's look at the numbers, the strategy, and the opportunity before you make your next move.
Milli Cannata
Vanguard Properties
(707) 477-7839
Milli Cannata
REALTOR® / Broker Associate
Vanguard Properties
(707) 477-7839
DRE #01990936
Own Your Dreams
SOURCE / DISCLAIMER LANGUAGE
Sources: SFAR Super Regional MLS & BrokerMetrics. Property types covered: Single-family. Only property data posted on the MLS is covered. All information is deemed reliable, but not guaranteed for accuracy. All data is subject to errors, omissions, revisions, and is not warranted. ©2026 Vanguard Properties. All rights reserved. Equal Housing Opportunity. DRE No. 01486075.
Categories
Recent Posts


GET MORE INFORMATION

Broker Associate | Lic# DRE# 01990936